
As a maintenance and reliability consultant, and as someone who is certified by the Society of Maintenance and Reliability Professionals as a Certified Maintenance and Reliability Professional, I often come under fire for being a little to pedantic when explaining the P-F Curve to a client. So let’s take a few minutes and back up to the 1950s. Long before the Internet or even your humble author was born, way back to when Elvis was still skinny, airline companies were dealing with unbearable maintenance costs. With the Boeing 747, a task force was formed to develop a plan for maintenance programs that would help to control costs and keep the planes safely in the sky. From this initial task force grew an idea that became Reliability Centered Maintenance. From the initial use in the airline industry, RCM spread to factories and facilities in every industry.
Some of the most useful bits of knowledge that grew out of RCM were the P-F curve and Age to Reliability curves. Most popular and most commonly known from the age to reliability curves are the bathtub, wear out, and infant mortality curves. The full set of curves is shown below in Figure 1:
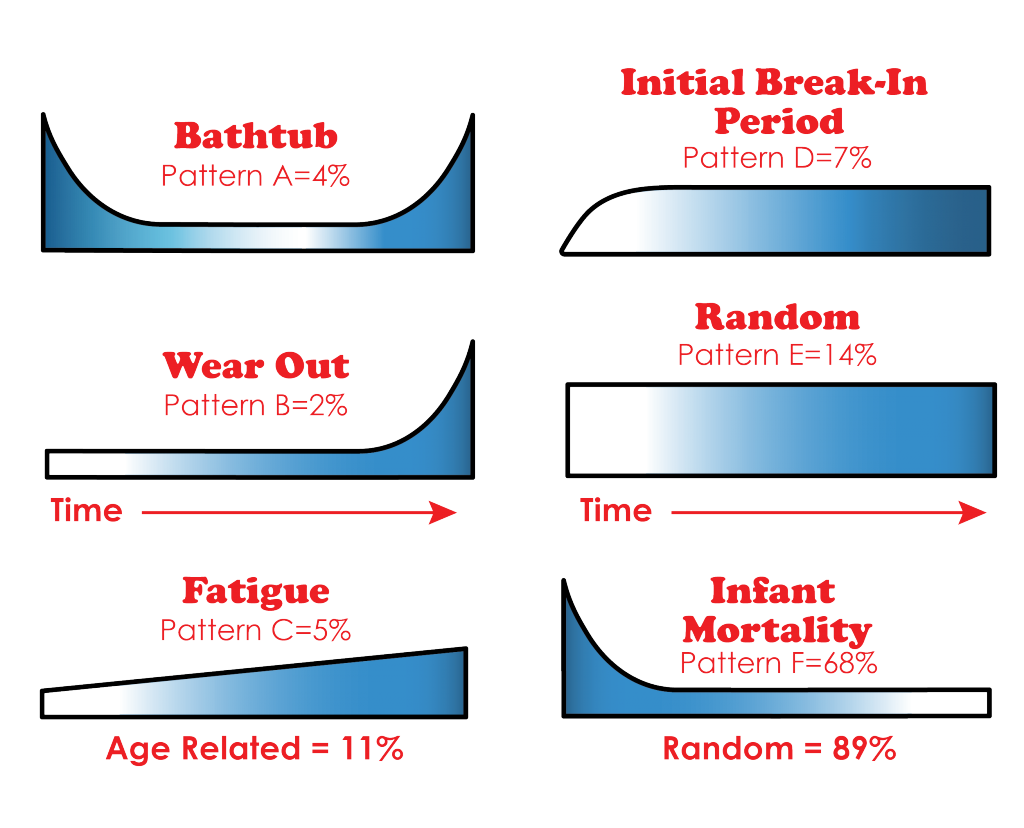
“Figure 1: Age of Reliability Curves”
From the age to reliability curves, the airline companies determined that, for the overwhelming majority of equipment, a general time frame to replace a component was not an efficient means to prevent failures. This prompted significant new thinking into how equipment was analyzed to determine maintenance and inspection frequencies. Simple, time-based intervals were no longer adequate, and Elvis started gaining weight.
One particularly important aspect of determining how to address a maintenance schedule is to determine the severity of the impact from a failure, and the ability to predict the failure. While this article will refrain from any more references to Elvis and risk-based work selection, we will focus on how we can gain a better understanding of predictable failures. For failure prediction, we can look to the advantages of Predictive Maintenance, or PdM, technologies and practices. PdM involves the use of thermography, ultrasonic detection, oil analysis, connected equipment and other means. While we are not in the 70s anymore, we can still gain insight from Kenny Rogers.
“You got to know when to hold ‘em, know when to fold ‘em, know when to walk away, know when to run.”
Wait a minute, I thought this was a maintenance blog? It is, so calm down and let me explain. First, let’s look at the P-F curve. The P-F, or Potential of Failure or probability of failure curve shows that as equipment ages, the chance of failure being detected becomes easier, but the cost of repair or cost of lost production time increases. An example of the P-F curve is shown below in Figure 2:
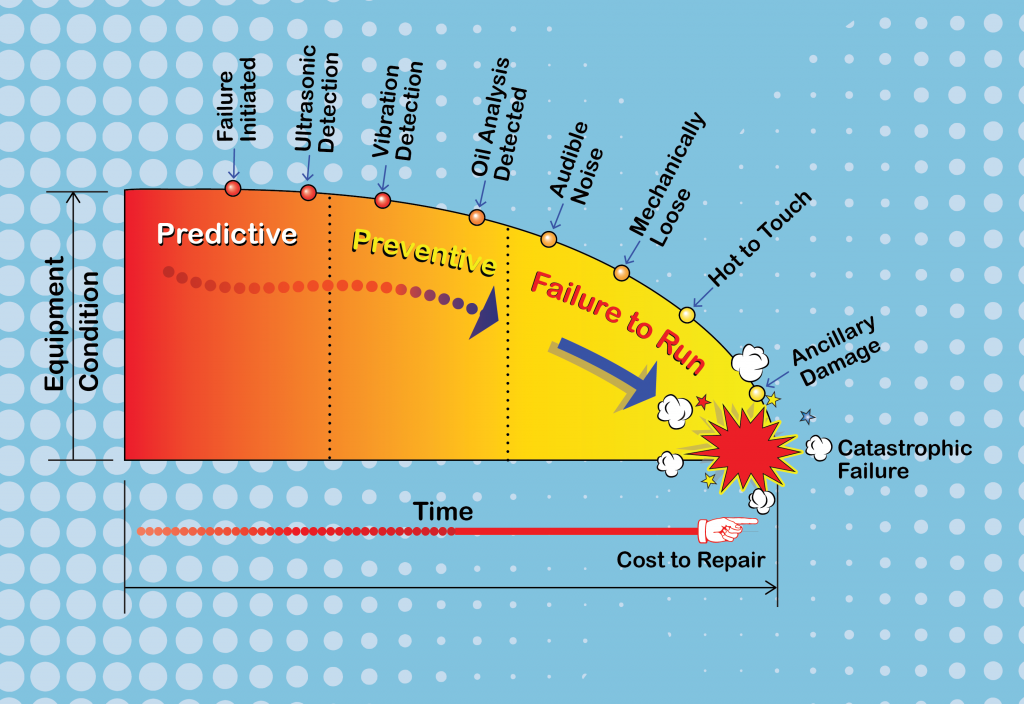
“Figure 2: P-F Curve”
Before a piece of equipment fails, and while there is no detectable problem, Kenny Rogers would have you “hold em.” Continue to monitor the equipment but you have no cause for other action at this time. However, once a defect becomes detectable, it’s time to “fold em,” or at least get a work order staged to take care of the problem before it becomes an emergency. If you’re not using predictive technologies, how are you going to catch a small problem while it is still easy (relative to the operations manager demanding minute to minute status updates) to repair? Uncorrected, the problem equipment could start making an abnormal noise. At this point, let’s walk away from the coffee break and get some work done. It may not be a catastrophe yet, but it’s working on it. At the end of the curve, prior to failure, a pump might be smoking hot. Having worked in process industries and power plants, I know about running to let the control station know that the issue might be beyond what your local safety manager approves. At this time, you better call Kenny Loggins because you’re in the DANGER ZONE.
Now that we have discussed Elvis, Kenny Rogers, and Kenny Loggins, oh and the important maintenance curves above, what is the benefit of incorporating these curves into your working knowledge of maintenance? So long as you’re not “Too Legit To Quit,” or at least your parachute pants (ok at this point I really am done with song references) are in the closet with your ego, we can use these curves to help shift from a reactionary maintenance department to one that is proactive. Proactive maintenance departments save the organization money. Improved effectiveness resulting from the proper inclusion of the curves can result in serious costs savings. TTS has had clients save millions of dollars year after year from improved maintenance performance. If you would like to connect with TTS to learn more, please Like, Share, Follow, Retweet, or just call us at (813) 980-1100. Regardless, Have Fun Storming the Castle. Stay tuned for future posts that will look at predictive techniques to identify potential failures.